
A Real World Export Compliance Story Export compliance isn’t just regulations and procedures – it’s real people making difficult decisions under pressure. In this honest conversation, Star USA is joined by Julie Detmering to discuss her company’s voluntary self-disclosure journey,…


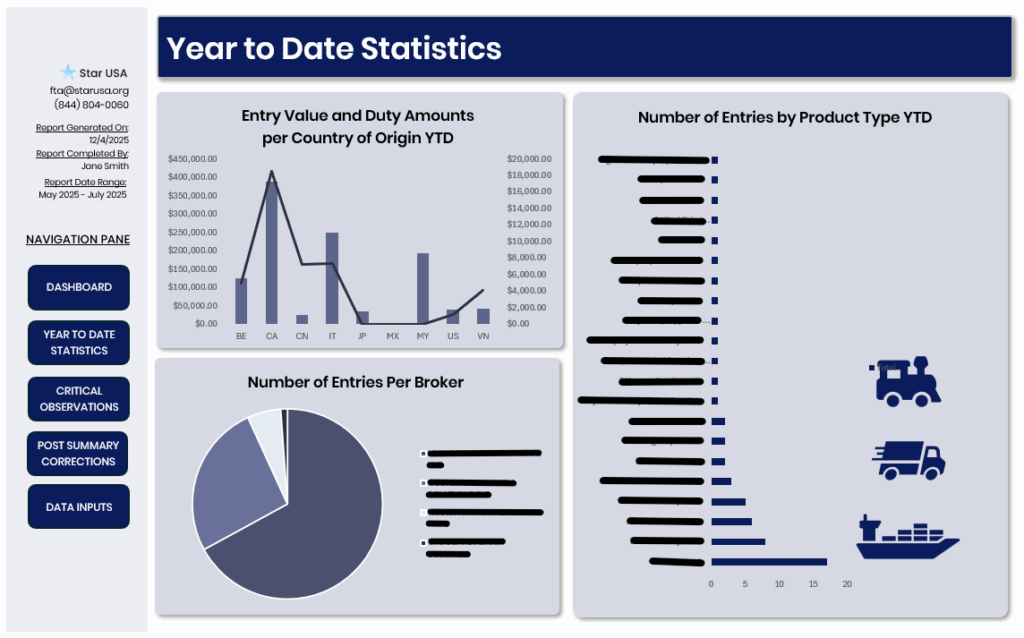
Executive Trade Compliance Dashboard: Setup Tips & Metrics
Executive Trade Compliance Dashboard: Setup Tips & Metrics
March 4, 2026/

Nic Arters
Director, Star USA
For executives at your business, making decisions without a trade compliance dashboard can feel like driving to an unfamiliar destination without a map or GPS. They’ll likely get where they want to go, but it may involve missed turns and obstacles. Like a map, a trade compliance dashboard helps executives make informed choices and plot the business’s next move.
Logistics and compliance professionals often ask for our input on their executive trade compliance dashboard, from platform selection to the metrics that matter. I’ve collected our learnings and best, most actionable tips below.
Key Takeaways
- An executive trade compliance dashboard is a visual tool that summarizes important compliance metrics at a glance.
- Use it as a tool to turn raw data into actionable insights.
- Effective dashboards are built around your specific risks, data, and decision-making needs, not a generic set of prebuilt metrics.
- A dashboard that actually gets used ties metrics to named decisions and limits views to only top-line information.
Bottom line: An executive trade compliance dashboard is not a repository of every available data point. It’s a focused, decision-making support tool designed to help leadership quickly understand risk, operational health, and financial exposure, then act accordingly. Let’s go!
How to Build Dashboards Executives Will Actually Use
If you’re like me and want the high-level overview first, this section is for you. Keep reading after this section for more details and hard-earned insights!
What I’ve learned over the years is that even well-designed dashboards can fail if they’re difficult to interpret or disconnected from leaders’ decision-making. The most effective dashboards are built with usability and accountability in mind.
Establish Governance and Clear Definitions
Each metric should have a defined owner, a consistent calculation, and a clearly identified data source. This governance ensures accuracy and builds trust in the dashboard over time.
Without clear definitions, metrics can quickly become inconsistent or disputed, reducing confidence in the reporting.
Design for Action, Not Observation
Dashboards should allow your executives to easily move from high-level indicators to deeper analysis when they want to. An effective structure should support this progression:
- Executive summary to trend analysis
- Root-cause identification
- Corrective actions
Align Reviews to a Practical Cadence
Consider a structured review rhythm:
- Weekly operational check-ins
- Monthly trend reviews
- Quarterly program assessments
This cadence keeps the dashboard relevant and helps make sure issues are addressed before they pile up.
Focus on Decision Support
Two practices consistently separate actively used dashboards from those that get ignored.
First, tie metrics to named decisions. Leadership should be able to identify what action might follow a change in any key indicator.
Second, limit and tier metrics. Executives need a concise set of top-level indicators, with additional detail available through drill-down views. Executives tell my team that when too many metrics compete for attention, none stand out.
Initial Dashboard Setup: Pursue Quality Over Quantity
Now, let’s get into the details, starting with the dashboard golden rule: emphasize clarity over volume. Fight against the urge to include every single data point! Instead, highlight the few metrics that signal whether shipments are moving smoothly, controls are working, and costs are predictable.
A balanced dashboard typically combines leading indicators, which highlight developing risks, and lagging indicators, which confirm outcomes and performance trends.
Executive dashboards work best when every number helps executives answer this: What decision would we make differently if this changes?
Selecting a Platform: What Matters?
There’s no single software platform that works for every organization. Some companies build effective dashboards in Excel, while others integrate reporting into existing compliance or ERP systems. I always tell our clients that the platform itself matters less than whether the metrics are relevant, reliable, and actionable.
Data Sources & Dashboard Structure
So, you already committed to quality data over quantity. Awesome! Now, you need to choose where the data comes from. Reliable dashboards draw from trusted data sources like ACE entry data, ERP systems, broker reports, and screening tools.
They also use consistent definitions (e.g., what counts as an “error?”) and automatically compiled data from sources. Without that foundation, dashboards quickly lose credibility and stop being used.
As I covered earlier, a well-structured dashboard also aligns with decision-making cycles. Here’s why:
- Weekly reviews help identify emerging risks and operational issues, such as shipment delays caused by compliance holds, screening exceptions, missing entry data, or licensing gaps.
- Monthly reviews reveal trends and control effectiveness, including entry errors, post-entry corrections, broker performance, and recurring root causes.
- Quarterly reviews provide a broader view of risk exposure and program health, like audit findings, penalty trends, duty impacts, and whether compliance investments or process changes are needed.
Alignment that’s built into the dashboard structure makes your life easier when it’s time to export or create reports.
Putting It All Together: A Minimum Viable Dashboard
If you’re starting from scratch, I recommend launching a minimally viable dashboard first. For a mid-market importer, this often includes a small but impactful set of metrics, like:
- Entry error or correction rates
- Shipments missing key data at filing
- Denied party screening exceptions
- Licensing alignment
- Duty spend trends
- FTA utilization
- Broker performance
- Open compliance issues
Together, these provide a clear snapshot of operational stability and exposure without the bloat of every single possible data point.
More Import Compliance Metrics That Matter
Okay, you’ve built your minimum viable dashboard, and now you’re looking to make it more robust, but not overdone. Consider layering on entry and filing health, since these metrics reflect the effectiveness of daily processes. Error rates, timeliness, exception volume, and rework levels are strong indicators of whether controls are functioning properly.
Early Warning Metrics
Certain signals are especially valuable as early warnings. Rising post-summary corrections, increasing broker rejects, and frequent changes to HTS classifications or values after filing all point to control weaknesses that regulators often examine during audits. A single spike may not be significant, but sustained upward trends are meaningful and should trigger investigation.
Quality & Control Gap Metrics
Post-entry corrections and protests are particularly useful metrics because they provide insight into both quality and control gaps. On one hand, corrections demonstrate that errors are being identified and resolved.
On the other, recurring corrections in the same areas like classification, valuation, or origin often indicate upstream process problems. Patterns tied to specific products, brokers, or data elements are especially important to monitor, as they reveal systemic risk rather than isolated issues.
Classification accuracy is another core risk driver. The most defensible way to measure it is through a risk-based sampling and audit approach supported by tracking HTS changes over time and monitoring audit outcomes. Sampling demonstrates proactive oversight, while variance tracking helps identify instability in classification practices.
Executives also respond strongly to metrics framed in financial and operational terms. Duty spend volatility and retroactive adjustments directly affect cash flow and forecasting. Error and correction rates signal potential penalties, audits, and operational disruptions. FTA eligibility compared to utilization highlights missed savings opportunities that impact margins. When presented in this language, compliance metrics become clearly tied to business performance rather than abstract regulatory requirements.
Export, Sanctions, and “Don’t-Get-on-the-News” Risk Metrics
So far, we’ve covered import metrics that can help you or your business leaders manage operational control. Export and sanctions metrics, however, address a different category of risk, one that can escalate quickly and attract public or regulatory attention.
Executive dashboards should include a small set of indicators that reveal whether export controls and sanctions processes are functioning consistently and predictably.
Screening and Licensing Hygiene
Key indicators often include screening coverage rates, escalation cycle time, licensing alignment, and repeat exception categories. High screening coverage and timely resolution of escalations generally indicate a stable process, while gaps in screening or unresolved cases suggest exposure.
It’s also important to interpret screening metrics correctly. A high screening hit rate doesn’t necessarily mean high risk, since many hits are false positives. What matters more is the true match rate, investigation quality, and how quickly potential issues are resolved.
Aging or unresolved screening cases typically represent the greatest exposure.
Process Integrity and Repeat Issues
Metrics that track documentation completeness, exception handling, and repeat root causes help identify process weaknesses early. A declining number of repeat issues often indicates improving controls, while recurring issues suggest corrective actions may not be addressing the underlying cause.
These insights allow teams to intervene before problems reach regulators or customers.
Training and Program Maturity Indicators
Forward-thinking organizations treat compliance training as an asset, not a box to check. They should also be tracked accordingly. Training metrics can provide valuable insight when they measure competency rather than attendance. Role-based training coverage, knowledge assessments, and correlations between training and reduced repeat errors offer meaningful indicators of program maturity!
Without this connection to outcomes, I’ve seen how training metrics can risk becoming administrative rather than strategic.
Interested in Training?
Upskill your team with impactful sessions led by our experts.
Connecting Export Metrics to Business Outcomes
Executives engage most when compliance metrics are tied directly to operational performance.
- Faster screening resolution supports shipment speed and customer reliability.
- Predictable licensing processes reduce delays.
- Fewer escalations and repeat issues lower enforcement risk and protect brand reputation.
At this level, the focus shifts from regulatory requirements to business continuity and revenue protection.
Trade Compliance Dashboards: Your Living Control System
Move from the reactive scramble to a proactive strategy. You can get there by focusing your trade compliance dashboard on a small set of decision-grade metrics tied to risk, operational stability, and financial exposure. The strongest dashboards combine leading and lagging indicators, use consistent definitions, and support investigation into trends and root causes.
Most importantly, dashboards should be treated as a living control system. They should be reviewed regularly, refined as risks evolve, and aligned with how leadership actually makes decisions.
If you want to improve compliance visibility or build executive reporting that drives action, our team at Star USA can help make sure your dashboard reflects the metrics that truly matter! Start the conversation.
Frequenty Asked Questions
Related Posts

Data Quality in Trade Compliance: Governance Practices That Prevent Costly Errors and Delays
Melissa MerkleManager, Star USA Data quality is a major risk control across trade compliance. Data quality issues like inconsistent classifications, unreliable origin determinations, and incomplete valuation details can compound across systems. They may not be noticed for a while, but they surface as customs holds, duty miscalculations, or enforcement actions. The good news is that…

Case Study on Navigating a CF-28: How a Newly Independent Manufacturer Turned Its First Compliance Test Into a Win
Eight months isn’t a lot of time, but that’s precisely how long we had to help a brand-new independent industrial paints manufacturer build a compliance program from the ground up, after divesting from its former organization. Then, right after the dust settled, they received a CF-28 (CBP Form 28) letter. Not an ideal scenario for a business still in its infancy. Before…

Designing a High-Performance Trade Compliance Program Operating Model: Roles, Routines, and KPIs
Melissa Merkle Manager, Star USA Trade compliance programs fail in predictable ways. Not because companies lack the intention to get it right, but because good intentions don’t hold up when there’s no clear structure behind them. When performance is measured by activity rather than outcomes, compliance becomes reactive and absorbs problems rather than prevents them. Building something better starts with three…

Tariff Savings Case Study: Identifying $2M+ in Client’s Potential Savings
Most compliance engagements start with a signed contract. This one started with a refusal. When a major U.S. importer issued a competitive RFP for trade compliance services, the conventional move would have been to sharpen our pencils, compete on price, and hope for the win. Instead, we realized the importer needed more than just another vendor. They needed…